You're about to create your best presentation ever

Tableau Presentation Background

Create your presentation by reusing one of our great community templates.

Tableau

Transcript: Usability Faster Performance Tableau is a leading developer of data management solutions for a variety of industries. Founded in California in 2003 and privately held, Tableau is now headquartered in Seattle, Washington. Smart Maps Tableau 9.0: What's New New Server and Online Answer geographic questions more easily Individual performance improvements in Tableau 9.0 combine to provide unprecedented overall speed increases across workbooks. Tableau develops easy-to-use solutions, so that users can focus on what’s more important: the data itself. Their solutions are intended to transform the way people use data to solve problems. They allow users to analyze and track all kinds of data faster, in an easier and more effective way. Tableau offers five main products: Tableau Desktop, Tableau Server, Tableau Online, Tableau Reader and Tableau Public. Connecting to messy spreadsheets with Tableau is fast and easy. Fix data while you connect and skip Excel. Tableau Server has been rebuilt from the ground up to be faster, more scalable, and more extensible—all while sporting a new look and more intuitive navigation. For the third time, Tableau is a leader in the Gartner Magic Quadrant for Business Intelligence and Analytics Platforms report. Data Preparation Tableau helps people see and understand data Instant visual feedback as you experiment with data. Exploring and presenting your data is easier, faster, and more beautiful than ever before. A Leader. Again. Analytics in the flow

OCA Tableau Presentation

Transcript: Office of the City Auditor August 2017 What is Tableau? TABLEAU Tableau is a Business Intelligence Tool used for data visualization. With Tableau, you can gain insights by just visualizing the stats that you already have with you and use it for your development of your department. Tableau is an interactive data visualization tools that enables you to create interactive and apt visualizations in form of dashboards, worksheets to gain business insights for the better development of your company. It allows non-technical users to easily create customized dashboards that provide insight to a broad spectrum of information. The OCA Department is gradually converting from using MS Excel to Tableau when reporting data. OCA realized the benefits and value of data visualization when making decisions or data analysis. Office of the City Auditor Office of the City Auditor PROS ADVANTAGES Main Advantages Amazing Data Vizualization Amazing data visualization https://public.tableau.com/en-us/s/gallery/amazon-rainforest?gallery=featured It has the ability to perform fairly complex data visualization in a very intuitive, drag and drop manner. Its data visualization is also impressively interactive. The user can highlight sections and drilldown into charts without extensive skills or assistance from IT. Excellent mobile support Excellent Mobile Support Tableau put a lot of effort into developing a robust mobile client. Touch-optimized controls make accessing and viewing data trouble free, and visualizations are automatically streamlined for mobile devices. Plus, the user doesn’t have to take any steps to make dashboards mobile- Tableau automatically recognizes if the user is using the mobile app and makes adjustments. Low-cost solution to implement and upgrade Low-cost solution to implement and upgrade Tableau is a relatively low-cost solution when compared to the known BI like Business Objects and Domo. Upgrades and implementations are effortless to install. Impressive integration Impressive Integration Tableau integrates with most data types and offers out of the box integration with a variety of big data platforms. Tableau integrates with R, the business intelligence statistical language many data scientists use to dive deep into BI for statistical and advanced analytics. When it comes to Excel and Tableau specifically, there are three core differences to consider: MS Excel vs Tableau MS Excel vs Tableau MS Excel Data Discovery Data Discovery Tableau - drilling into the data is less flexible - harder to explore information on a granualar level - drill-down and data blending features built in - freely explore data MS Excel Automation Functionality Automation Functionality Tableau Both Excel and Tableau can work with static and live data from multiple sources. - Automatically refreshing an Excel worksheet involves manually programming processes or creating macros that automatically update the worksheet’s data when you open the file. - Tableau is a little more intuitive with creating processes and calculations. For example, when creating calculations in a tabular format, the formula can be typed once, stored as a field and applied to all rows referencing that source. In Excel, you first manipulate the data on the cell level, and then manually create visualizations like graphs, charts, PowerPoint presentations, etc. Visualizations Visualizations MS Excel Tableau Tableau visualizes data from the start, allowing you to see the significance right away. Tableau differentiates correlations using color, size, labels and shapes, giving you context as you drill down and explore on a granular level. SEA Report Tableau Version SEA Report Copy and paste the link into a search bar https://public.tableau.com/profile/lyra.pacpaco#!/vizhome/CHAPTER1OnlineReport_0/ServiceEffortsAccomplishments2016?publish=yes Tableau Sample SEA Report Online Version WHAT'S NEXT Fiscal Year 2016 Future KEEP IN MIND KEEP IN MIND Most of the other States have changed their way of reporting. Tableau has a great influence on the efficiency on data interpretations and data visualizations. Is it time to adapt the new technology?

Tableau Intern Presentation

Transcript: Provides self-service tools and administrative functionality to help with site management and operational issues related to Tableau Online Ninja Escape Room - Zombie Escape Ice Cream Breaks Intern Summit Breakfast w/ Adam Selipsky Sounders Game Intern Hackathon - Project Frelard Intern Kayaking at Agua Verde All Hands Meeting & Employee Party TechOps Dive Bar Tableau BBQ at Gas Works TechOps Mariners Game EASE Team Morale Event - Lake Union Scavenger Hunt Activate Site Intern Events- My growth at tableau Monitor nightly stage coverage for all development projects UI Layer for the Zeus Web Service Monitored SFDC Release Deployment Delete Site Requirements grooming Functional Testing Utilizing automation infrastructure and test tools to automate tests Report bugs Run predeploy tests Forseti capabilities- Edit Site Information My Forseti Work- Improves the reliability of testing and operations in Sandbox Provide support for automated runs for deployment coverage QA Projects I worked with- Enterprise Applications - Automation Test Suite Team - EATS Develop testing and monitoring tools that provide production monitoring for several Enterprise Application Systems Created Build Verification Used in Continuous Integration Environment My Projects My Tableau Intern Experience Software Testing: Manual & Automation Testing Importance of Testing Environments Build Verification Tests Used with Continuous Integration Deployments Importance of Teamwork and Communication Future in Operations - Automation QA Responsibilities Production Code PyCharm & Selenium EATS Automation Infrastructure- Domain Objects: Encapsulates Business Logic Instance Objects: Makes Selenium Calls and Tracks State of the Page What I learned Forseti Demo Adding Site Users Develop infrastructure to cover testing needs What I learned: Team Events- Create Sites Investigate and resolve customer issues Intern and Team Events Migrate Site From My Intern Projects From My Intern Experience What I learned: Implemented Automation Infrastructure In EATS Automated tests Researched triggering Bamboo Jobs via REST API's Tasks: Forseti: what is it? Enterprise Applications Sustaining Engineering - EASE QA Tasks: Customer HUB- Tested functionality Find, report and drive bugs to completion Create and assign bugs in JIRA Salesforce- Learned terminology Ran test plans Created data for Customer HUB

Tableau

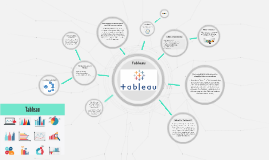
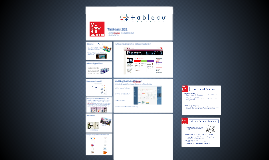
Transcript: Tableau in the Classroom What is Tabelau? What is Tabelau? The name of this strategy comes from the term tableau vivant which means “living picture.” In this activity, students recreate a moment in time, a definition, a concept, or an idea. This is done using their bodies, facial expressions, props, and potentially, a small script. Critical Reading Extension: Students choose a character, object, or portion of the problem to bring to life. After the initial freeze frame, each actor comes to life, expressing the thoughts, feelings, or attributes of that character or object. ELA / History ELA / History Tableau is very simple to implement into these subject areas: History: Recreate a moment in time using historical pictures and information. EX. Engraving made by Paul Revere EX. Civil War EX. Urbanization or Industrialization ELA: Recreate a scene from a novel, article, short story, etc. EX. The Trial in To Kill a Mockingbird EX. Literally all of The Crucible EX. Literary Devices or Vocabulary Industrialization Industrialization Trial Scene Trial Scene Tableaus Tableaus Science Science Tableaus can be used to explain a concept, a phenomena, a term, or a method: Parts of a cell The Water Cycle The Scientific Method Anatomical Heart Molecular Structure Shark Week More specifically, the Megalodon Math Math Betcha didn't think we could use Tableux in MATH: .....you're right. Confusion Confusion Examples: Examples: ........... But really: But really: Order of Operations Angles Proofs Equations Formulas Order of Operations Order of Operations Important Takeaway Important Takeaway Detail #1

Tableau

Transcript: Locked arm in arm they cross the way (a) The black boy and the white, (b) The golden splendor of the day (a) The sable pride of night. (b) From lowered blinds the dark folk stare (c) And here the fair folk talk, (d) Indignant that these two should dare (c) In unison to walk. (d) Oblivious to look and word (e) They pass, and see no wonder (f) That lightning brilliant as a sword (e) Should blaze the path of thunder (f) irony Alliteration Locked arm in arm they crossed the way The black boy and the white, The golden splendor of the day The sable pride of night. From lowered blinds the dark folk stare And here the fair folk talk, Indignant that these two should dare In unison to walk. Oblivious to look and word They pass, and see no wonder That lighting brilliant as a sword Should blaze the path of thunder. By Countee Cullen Tableau Locked arm in arm they cross the way The black boy and the white The golden splender of the day The sable pride of the night From lowered blinds the dark folk stare And here the fair folk talk Indignant hat these two should dare In unison to walk Oblivious to look and word They pass, and see no wonder That lightning brilliant as a sword Should blaze the path of thunder. What imagery is used in the poem? in the line " Locked arm and arm they cross the way"(sight) "From lowered blinds the dark folk stare" (sight) "And here the fair folk talk" (sight/hear) Taste, smell and touch is not used. What is their tone? reflective What is the message (theme) of this poem? that friendship has no color boundaries and to accept others. Simile this symbolizes the black boy the lightning comes before thunder onomatopoeia personification hyperbole allusion Locked arm in arm they cross the way The black boy and the white, The golden splendor of the day The sable pride of the night From lowered blinds the black folk tare And here the fair folk talk Indignant that these two should dare In unison to walk Oblivious to look and word They pass and see no wonder That lighting brilliant as a sword Should blaze the path of thunder Whats not in the poem! Have they been able to reach their dream? why or why not? yes to a extent.There is still much judgement but now blacks and whites are considered equal. metaphor Who is the speaker? The speaker is a white person because in the line " and here the fair folk talk" it indicates the speaker is among the white"fair" people. This symbolizes the white boy thunder comes after lightnining metaphor What is the Rhyme scheme? A,B,A,B,C,D,C,D,E,F,E,F Symbolism What is the dream of the speaker in the poem? The dream is that there is no judgement and that there will be equality.

Tableau

Transcript: The Tableau Product Suite The great thing about Tableau software is that it doesn't require any technical or any kind of programming skills to operate. The tool has garnered interest among the people from all sectors such as business, researchers, different industries, etc. Table of Contents: Excel Vs Tableau Conclusion 1- What is Tableau? 2- The best features of Tableau. 3- The Tableau product suit. 4- Tableau classifications. 5- Excel Vs Tableau. 6- Conclusion. Tableau is a powerful and fastest growing data visualization tool used in the Business Intelligence Industry The best features of Tableau Data analytic in tableau can be classified into two sections What is Tableau? Tableau is a powerful and fastest growing data visualization tool used in the Business Intelligence Industry. It helps in simplifying raw data into the very easily understandable format. Any question?? Data analysis is very fast with Tableau and the visualizations created are in the form of dashboards and worksheets. The data that is created using Tableau can be understood by professional at any level in an organization. It even allows a non-technical user to create a customized dashboard. What is Tableau? Data Blending Real time analysis Collaboration of data Tableau Data analytic in tableau can be classified into two sections 2- Sharing Tools: As the name suggests, the purpose of the tool is sharing the visualizations, reports, dashboards that were created using the developer tools. Products that fall into this category are Tableau Online, Server, and Reader. Tableau The best features of Tableau 1- Developer Tools: The Tableau tools that are used for development such as the creation of dashboards, charts, report generation, visualization fall into this category. The Tableau products, under this category, are the Tableau Desktop and the Tableau Public. Done by Ghada Alghamdi 201312214 Both Excel and Tableau are data analysis tools, but each tool has its unique approach to data exploration. However, the analysis in Tableau is more potent than excel. Excel works with rows and columns in spreadsheets whereas Tableau enables in exploring excel data using its drag and drop feature. Tableau formats the data in Graphs, pictures that are easily understandable.

Tableau 101 Presentation

Transcript: Data Scientists: These professionals process raw data and determine what types of analysis will deliver the best results. These people have backgrounds that include math and statistics, as well as artificial intelligence and natural language processing. Data Visualizers: These days, a lot of decision-makers rely on information that is presented to them in a highly visual format -- either on dashboards with colorful alerts and "dials," or in quick-to-understand charts and graphs. These professionals "harness the data” and put it in context, in layman's language; exploring what the data means and how it will impact the organization. Getting Down to Vizness! How does it work? 1) Connect to the Data A French word meaning “a graphic description or representation; a view or sight that looks like a picture; a striking or artistic grouping”. 4 Quick Steps to Creating an Interactive Visualization 4) Create a Dashboard and/or Story 3) Build a View What kind of Data Consumer are You? Histogram - Show distribution across groups Pie - Show Proportions An American computer software company headquartered in Seattle, Washington, that produces a family of interactive data visualization software. Fairy Tale Documentary Map - Show Geocoded Data Heat Map - Show relationships between 2 factors I've got a theory, now what chart do I use? Tableau Desktop 9.2 or Tableau Reader 9.2 Bubble - Show concentration of data along 2 axes 2) Select the Chart Type Convert “big data” into intuitive and easy to use graphical dashboards Give decision makers access to data they can manipulate themselves Enable MHE associates to self-serve https://spark.mheducation.com/groups/tableau-center-of-excellence Gantt - Show Use Over Time Scatter Plot - Show relationships of variables What story do you want your data to tell? Bullet - Evaluating performance against a goal Tableau 101 Jamie Muetzel | Business Analyst April 6, 2016 Tableau 101 Bar - Comparing Data across Categories What's it good for? Line - Viewing Trends in Data Over Time What is ? Got Data?

Now you can make any subject more engaging and memorable