You're about to create your best presentation ever

Strong Poster Presentation Template

Create your presentation by reusing one of our great community templates.

strong presentation

Transcript: in the beginning... there was a void... (specifically, in the Dallas-Fort Worth technology market.) and Omary said, “Let there be light!” Dr. Mohammad Omary, that is, UNT associate professor of chemistry whose patented research on organic light-emitting diodes, might one day replace the which meets one of the four global challenges of the next century, energy, according to this guy... UNT is meeting Siebel’s other global challenges, as well: power of place UNT’s Discovery Park UNT’s Discovery Park is the only university affiliated research park in Dallas-Fort Worth, the fifth largest metropolitan area, representing the fifth largest concentration of high-tech employees, in the nation (AeANET). Fifteen miles north of Dallas-Fort Worth International Airport, and 4.5 miles north of the UNT main campus in Denton, UNT’s Discovery Park sits on 285 acres of flat Texas prairie land and has more than half-a-million square feet under roof, ample room for growth. The Park, once a Texas instruments, Inc., plant which built electronics for cruise missiles systems, is now home to another kind of smart system: students from UNT’s College of Engineering and College of Information, Library Science and Technologies. Also on-site are several UNT laboratories and centers, including the federally funded Center for Advanced Research and Technology (CART) and Institute for Science and Engineering Simulation (ISES). Not to mention a coffee bar for late night experimenters. UNT’s Discovery Park is already working with a number of companies, including Lockheed Martin, Peterbuilt, and NuconSteel, as well as local and regional governments. Incubating Technology Companies UNT’s Discovery Park works with emerging technology companies to increase their odds of success and to decrease their time to capital markets. Discovery Park is a nonprofit division of the University of North Texas. Its mission is to create jobs and wealth in North Texas through technology entrepreneurship, and to provide unparalleled opportunities for the UNT research community. Discovery Park welcomes an opportunity to help you with: Advisory Services Education & Networking Events Finances & Accounting Ground and Office Leasing Incubator Training Intellectual Property & Technology Legal Assistance Master Planning Office Operations Real Estate Solutions PR & Marketing Sales Assistance University-Industry Partnerships UNT’s continued efforts to breed strong university-industry connections are encouraging partnerships that will allow university discoveries to propel industry forward. UNT plans to capitalize on the Dallas-Fort Worth infrastructure and its own deep intellectual resources in the development of the nearly 290-acre Discovery Park. Already, the research park is home to an array of laboratories and centers that include the federally funded Center for Advanced Research and Technology and the Institute for Science and Engineering Simulation. In addition to Discovery Park’s recent partnership with Tech Fort Worth, a nonprofit business incubator helping commercialize innovative technologies, UNT is submitting entries to World’s Best Tech. There, venture capitalists from around the country can examine such work as faculty chemist Mohammad Omary’s patented research on organic light-emitting diodes. Business Incubator University Resources The goal of the UNT’s Discovery Park and its community partners is to facilitate smarter, faster startup and growth of emerging companies so those companies will become financially successful, high growth companies in the shortest time possible. increased economic development according to the Pew charitable trust, 40% of investing dollars go back into the community energy water power of place global competition global challenges council on competitiveness, federal initiative education, infrastructure, facilities increased economic development process of incubation: technology startup incubation acceleration acquire intellectual property according to the Pew charitable trust, 40% of investing dollars go back into the community food healthcare

Mini-Poster Template

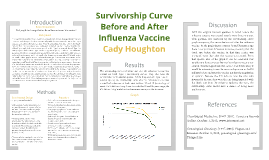
Transcript: Survivorship Curve Before and After Influenza Vaccine Cady Houghton Procedure Background Experimental Design Methods Research Question 1) A data base of cemeteries was looked up to find death dates and information. 2) From the data base information was put into a google drive document. 3) 40 people dying before the 1945 influenza vaccine were put into one chart showing the ages of death. 4) 40 people dying after the 1945 influenza vaccine were put into another chart also showing ages of death. 5) Both charts of groups of people were converted into a life history table. 6) From each life history table the data was put into another chart to make two survivorship curve charts. 7) The survivorship curve charts were put into one survivorship curve chart to show the difference in curves. A laptop was used for this lab. If the influenza vaccine works then if we compare the survivorship curve of before and after the vaccine it will show people living longer because the vaccine will be decreasing the death rate. The independent variable in this experiment is the influenza vaccine. The dependent variable is the death rate in this experiment. The exponential variables in this experiment are the other disease epidemics during the time period the data was chosen from. The control is the survivorship curve before the influenza vaccine and the experimental is the survivorship curve after the influenza vaccine. The survivorship curves of before and after the influenza vaccine was created are both Type I survivorship curves. They also have the caracteristics for K-selected species. While they are both Type I and K-selected species, the survivorship curve after the influenza vaccine was created had a decrease in death rates between 20 and 70 years of age of about .5 #/1,000 surviving. Then, towards the 75 and 90 years range, the #/1000 surviving leveled out and became extremely similar in curves. Did people die younger before the influenza vaccine was created? In comparing survivorship curves a Log10 scale is used for its ability to show you greater numbers in a more readable way and to show same mortality with the same curve when two scales are put together. In a Log10 scale there are three Types of information. The first, Type 1, are mainly humans. Type I survivorship curves are characterized by high survival in early and middle life, followed by a rapid decline in survivorship in later life. Type 2 is mainly birds and Type 3 is mainly reptiles. Within these Types are two categories of species, K-Selected, or Equilibrium, species and R-Selected, or Opportunist, species. K-Selected species usually have stable resources and a stable environment, and this is usually what humans are categorized as. R-Selected species are usually whose population size tends to fluctuate greatly in reaction to variations in the environment. Comparing the survivorship curves, defined as a graph showing the number or proportion of individuals surviving at each age for a given species or group cohort, before and after the influenza vaccine was created will show if the vaccine helped increase the population. Before the 1940s when the influenza vaccine was created, the epidemic was particularly deadly in US Army training camps, where the death rate was as high as 80% in some camps. Death rate is usually calculated as the number of deaths per one thousand people per year. usually calculated as the number of deaths per one thousand people per year. The US military was getting hit with influenza the most forcing them to developed the first approved vaccine for influenza, which was used in the Second World War. Studying this specific survivorship curve will also help to tell if their were more survival rates in the US military during the time. Results With the original research question in mind, before the influenza vaccine was created people were dying younger. This question was answered by the survivorship curve graph comparing the curves before and after the influenza vaccine. As the graph shows between 20 and 70 years of age there is a significant difference in curves, meaning that the death rate before the vaccine in that time period was increased more than after the vaccine was created. From that specific area of the graph it can be concluded that people were dying younger before the influenza vaccine was created, thus the hypothesis was correct. For future study it would be interesting to see the survivorship curve in the US military before and after the vaccine not just the population in general. Because the US military was the one who invented it because they were the one being impacted with the death rate from the influenza epidemic the most, the survivorship curve would have a chance of being more predominant. Graph Clear Digital Media, Inc. (1997-2011). Cemetery Records Online. October 1, 2013, www.interment.net Genealogical Gleanings. (1997-2004). Plagues and Diseases. October 3, 2013, genealogical-gleanings.com/Plauges.htm Introduction

Now you can make any subject more engaging and memorable