You're about to create your best presentation ever

Poster Template Presentation

Create your presentation by reusing one of our great community templates.

Poster Presentation

Transcript: Nerve Growth Factor NGF and Alzheimer's Acknowledgements Tau tangles and amyloid plaques hinder neuronal signaling Animal studies suggest that NGF can restore the signaling capability of cholinergic neurons Remember that cholinergic neurons are involved with learning and memory! More research with humans is needed We are currently recruiting participants for a preliminary clinical trial Participants will be compensated To be eligible, you must be: How does it work? Slows the progression of the disease Reduces the severity But, doesn't solve the problem Intranasal Drug Delivery We need help! Contact Information This is the most important part! Special thanks to: The Alzheimer’s Disease Research Center at the University of California, Los Angeles The Alzheimer's Association Noninvasive, painless, and easy to administer Rapid mechanism of action Restrictions of the blood-brain barrier are avoided A hormone called nerve growth factor (NGF) can now be delivered to the brain Quick Facts Naturally occurring hormone in the body Involved in the growth, maintenence, and survival of neurons Reduces neuronal degeneration Without NGF, neurons will die Can we cure Alzheimer's with a nasal spray? Cholinergic neurons function in learning and memory These neurons become degraded in AD patients What causes it? Alzheimer's Disease Unknown, but many theories exist Cholinergic hypothesis Yes, it all has to do with a new technique known as intranasal drug delivery! Male or female, 55 to 80 years of age Diagnosed with mild to moderate AD Be in good general health Be available 10 hrs/week for two years How do you treat it? What are the benefits? Randomized, double-blind study Parallel assignment of participants Control group will have the option of receiving NGF treatment after trial, provided results are safe and beneficial Adam Wong, Principle Investigator email@address.com (777) 123-4567 www.website.com Before we can answer this question, we must first learn a little about the disease. Drug molecules are applied to the nasal cavity as a fine mist The back of the nasal cavity, known as the olfactory mucosa, provides a direct link to the brain from the nose Bypasses first-pass hepatic metabolism (enzymatic degradation by the liver) Bypasses the blood-brain barrier (the brain's protective filter) But didn't you say a nasal spray might be the cure? Currently, there is no cure Only the symptoms can be treated Well, after this study, we are hoping the answer will be yes! For further information, or to inquire about participating, please contact: Or, visit us at our website at: Most common form of dementia Estimated 5.4 million cases in the US Symptoms worsen over time Late stages result in complete loss of independence, ultimately leading to death 6th leading cause of death in the US More details... Treatment group will receive NGF spray Placebo group will receive saline spray

Mini-Poster Template

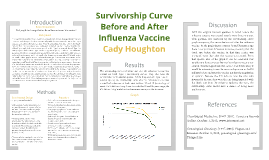
Transcript: Survivorship Curve Before and After Influenza Vaccine Cady Houghton Procedure Background Experimental Design Methods Research Question 1) A data base of cemeteries was looked up to find death dates and information. 2) From the data base information was put into a google drive document. 3) 40 people dying before the 1945 influenza vaccine were put into one chart showing the ages of death. 4) 40 people dying after the 1945 influenza vaccine were put into another chart also showing ages of death. 5) Both charts of groups of people were converted into a life history table. 6) From each life history table the data was put into another chart to make two survivorship curve charts. 7) The survivorship curve charts were put into one survivorship curve chart to show the difference in curves. A laptop was used for this lab. If the influenza vaccine works then if we compare the survivorship curve of before and after the vaccine it will show people living longer because the vaccine will be decreasing the death rate. The independent variable in this experiment is the influenza vaccine. The dependent variable is the death rate in this experiment. The exponential variables in this experiment are the other disease epidemics during the time period the data was chosen from. The control is the survivorship curve before the influenza vaccine and the experimental is the survivorship curve after the influenza vaccine. The survivorship curves of before and after the influenza vaccine was created are both Type I survivorship curves. They also have the caracteristics for K-selected species. While they are both Type I and K-selected species, the survivorship curve after the influenza vaccine was created had a decrease in death rates between 20 and 70 years of age of about .5 #/1,000 surviving. Then, towards the 75 and 90 years range, the #/1000 surviving leveled out and became extremely similar in curves. Did people die younger before the influenza vaccine was created? In comparing survivorship curves a Log10 scale is used for its ability to show you greater numbers in a more readable way and to show same mortality with the same curve when two scales are put together. In a Log10 scale there are three Types of information. The first, Type 1, are mainly humans. Type I survivorship curves are characterized by high survival in early and middle life, followed by a rapid decline in survivorship in later life. Type 2 is mainly birds and Type 3 is mainly reptiles. Within these Types are two categories of species, K-Selected, or Equilibrium, species and R-Selected, or Opportunist, species. K-Selected species usually have stable resources and a stable environment, and this is usually what humans are categorized as. R-Selected species are usually whose population size tends to fluctuate greatly in reaction to variations in the environment. Comparing the survivorship curves, defined as a graph showing the number or proportion of individuals surviving at each age for a given species or group cohort, before and after the influenza vaccine was created will show if the vaccine helped increase the population. Before the 1940s when the influenza vaccine was created, the epidemic was particularly deadly in US Army training camps, where the death rate was as high as 80% in some camps. Death rate is usually calculated as the number of deaths per one thousand people per year. usually calculated as the number of deaths per one thousand people per year. The US military was getting hit with influenza the most forcing them to developed the first approved vaccine for influenza, which was used in the Second World War. Studying this specific survivorship curve will also help to tell if their were more survival rates in the US military during the time. Results With the original research question in mind, before the influenza vaccine was created people were dying younger. This question was answered by the survivorship curve graph comparing the curves before and after the influenza vaccine. As the graph shows between 20 and 70 years of age there is a significant difference in curves, meaning that the death rate before the vaccine in that time period was increased more than after the vaccine was created. From that specific area of the graph it can be concluded that people were dying younger before the influenza vaccine was created, thus the hypothesis was correct. For future study it would be interesting to see the survivorship curve in the US military before and after the vaccine not just the population in general. Because the US military was the one who invented it because they were the one being impacted with the death rate from the influenza epidemic the most, the survivorship curve would have a chance of being more predominant. Graph Clear Digital Media, Inc. (1997-2011). Cemetery Records Online. October 1, 2013, www.interment.net Genealogical Gleanings. (1997-2004). Plagues and Diseases. October 3, 2013, genealogical-gleanings.com/Plauges.htm Introduction

Poster Presentation

Transcript: Events Competition? Entertainment in Ten Easy Steps We will focus on research posters How to make a poster using PowerPoint? 6. Add the graphics 7. Prepare for printing 8. Create a template for future use 9. Use your template in Ten Easy Steps Pictures and diagrams Easier to find information (topic titles) Easier to refresh memory Presenter there to answer questions Format in Ten Easy Steps using PowerPoint How to Make Great Posters (Cont'd) using PowerPoint Design What should you keep in mind as you design the poster? Poster Presentation Design (cont'd) Questions? Types of Posters 6. Add the graphics 6. Add the graphics 7. Prepare for printing 8. Create a template for future use 1. Make the Decision 2. Sketch it out on paper 3. Gather up the parts 4. Set up the page 5. Enter the text How to Make Great Posters How to Make Great Posters Visual Short / Precise No technical difficulty Selective learning Small groups setting Can convey the information even without a presenter Most useful type of posters for the packaging industry Appropriate for business presentations Appropriate for research presentations Advertisement How to Make Great Posters (Cont'd) 1. Make the Decision 2. Sketch it out on paper Keep the material simple - white space Use color sparingly Do not use more than 2 font types Titles and headings should appear larger - legible from a distance Why posters? All of the other font: 18 point minimum Do not use all UPPER CASE type A picture is worth a thousand words (diagrams, drawings,graphics...etc) Smooth arrangement of poster components Review - Spellcheck! Propaganda You do not want this How to Make Great Posters How to Make Great Posters How to Make Great Posters 1. Make the Decision 2. Sketch it out on paper 3. Gather up the parts 4. Set up the page using PowerPoint 1. Make the Decision 2. Sketch it out on paper 3. Gather up the parts Education How to Make Great Posters (Cont'd) Research in Ten Easy Steps 6. Add the graphics 7. Prepare for printing 1. Make the Decision Why Posters Open PowerPoint File --> Page Setup Enter width and height Choose orientation (Portrait vs Landscape) Draw a cutting line using rectangular drawing tool or line tool Begin adding text / graphics Don't forget to save periodically! as opposed to research papers? How to Make Great Posters (Cont'd) Vivian Wong Jennifer Smith Hable Yohannes A little bit of history using PowerPoint How to Make Great Posters 6. Add the graphics 7. Prepare for printing 8. Create a template for future use 9. Use your template 10. Plan ahead Advantages over PowerPoint Title Summary Introduction Theory / Methodology Results Conclusion Further Work using PowerPoint Activity Time! Often hung next to/near other posters Must catch passerby's attention Presenter must catch attention too - dress the part! using PowerPoint in Ten Easy Steps in Ten Easy Steps How to Make Great Posters (Cont'd) What is a poster? When were the first posters used?

Now you can make any subject more engaging and memorable