You're about to create your best presentation ever

Online Presentation Poster Template

Create your presentation by reusing one of our great community templates.

Mini-Poster Template

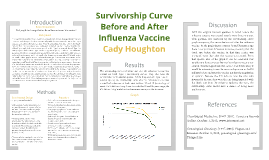
Transcript: Survivorship Curve Before and After Influenza Vaccine Cady Houghton Procedure Background Experimental Design Methods Research Question 1) A data base of cemeteries was looked up to find death dates and information. 2) From the data base information was put into a google drive document. 3) 40 people dying before the 1945 influenza vaccine were put into one chart showing the ages of death. 4) 40 people dying after the 1945 influenza vaccine were put into another chart also showing ages of death. 5) Both charts of groups of people were converted into a life history table. 6) From each life history table the data was put into another chart to make two survivorship curve charts. 7) The survivorship curve charts were put into one survivorship curve chart to show the difference in curves. A laptop was used for this lab. If the influenza vaccine works then if we compare the survivorship curve of before and after the vaccine it will show people living longer because the vaccine will be decreasing the death rate. The independent variable in this experiment is the influenza vaccine. The dependent variable is the death rate in this experiment. The exponential variables in this experiment are the other disease epidemics during the time period the data was chosen from. The control is the survivorship curve before the influenza vaccine and the experimental is the survivorship curve after the influenza vaccine. The survivorship curves of before and after the influenza vaccine was created are both Type I survivorship curves. They also have the caracteristics for K-selected species. While they are both Type I and K-selected species, the survivorship curve after the influenza vaccine was created had a decrease in death rates between 20 and 70 years of age of about .5 #/1,000 surviving. Then, towards the 75 and 90 years range, the #/1000 surviving leveled out and became extremely similar in curves. Did people die younger before the influenza vaccine was created? In comparing survivorship curves a Log10 scale is used for its ability to show you greater numbers in a more readable way and to show same mortality with the same curve when two scales are put together. In a Log10 scale there are three Types of information. The first, Type 1, are mainly humans. Type I survivorship curves are characterized by high survival in early and middle life, followed by a rapid decline in survivorship in later life. Type 2 is mainly birds and Type 3 is mainly reptiles. Within these Types are two categories of species, K-Selected, or Equilibrium, species and R-Selected, or Opportunist, species. K-Selected species usually have stable resources and a stable environment, and this is usually what humans are categorized as. R-Selected species are usually whose population size tends to fluctuate greatly in reaction to variations in the environment. Comparing the survivorship curves, defined as a graph showing the number or proportion of individuals surviving at each age for a given species or group cohort, before and after the influenza vaccine was created will show if the vaccine helped increase the population. Before the 1940s when the influenza vaccine was created, the epidemic was particularly deadly in US Army training camps, where the death rate was as high as 80% in some camps. Death rate is usually calculated as the number of deaths per one thousand people per year. usually calculated as the number of deaths per one thousand people per year. The US military was getting hit with influenza the most forcing them to developed the first approved vaccine for influenza, which was used in the Second World War. Studying this specific survivorship curve will also help to tell if their were more survival rates in the US military during the time. Results With the original research question in mind, before the influenza vaccine was created people were dying younger. This question was answered by the survivorship curve graph comparing the curves before and after the influenza vaccine. As the graph shows between 20 and 70 years of age there is a significant difference in curves, meaning that the death rate before the vaccine in that time period was increased more than after the vaccine was created. From that specific area of the graph it can be concluded that people were dying younger before the influenza vaccine was created, thus the hypothesis was correct. For future study it would be interesting to see the survivorship curve in the US military before and after the vaccine not just the population in general. Because the US military was the one who invented it because they were the one being impacted with the death rate from the influenza epidemic the most, the survivorship curve would have a chance of being more predominant. Graph Clear Digital Media, Inc. (1997-2011). Cemetery Records Online. October 1, 2013, www.interment.net Genealogical Gleanings. (1997-2004). Plagues and Diseases. October 3, 2013, genealogical-gleanings.com/Plauges.htm Introduction

Disability Online Poster Presentation

Transcript: Disability Oppression & marginalization of the world's largest minority group Exploitation: People living with disabilities are often marginalized. If they can find employment, they are usually ask to perform menial labor. Marginalization: People with disabilities are often excluded from common privileges in society, such as access to transportation and housing. Cultural Imperialism: People living with disabilities have relatively little influence in the dominant culture. Resources for disabled people are not readily available as their needs are different from the dominant culture. Powerlessness: People with disabilities are often impoverished and don't have power to affect change within their communities. Violence: Disabled people, particularly women, often live in fear that they will be hurt or attacked due to their identity within a group that is often perceived as weak and powerless. DISCRIMINATION against the disabled, or ableism, is discriminatory action against people based on the physical ability of their body, especially against people with disabilities in favor of people who are not disabled (Disabled World News, 2009). Direct Discrimination Discrimination that occurs when an individual or group treats a person living with a disability less favorably than a person living without a disability. Areas that this may occur in are employment, education, and access to services or goods (Disabled World News, 2009). Indirect Discrimination Discrimination that occurs when there is not a direct intention to exclude people living with disabilities, however, their needs or accommodations are not met due to a lack of knowledge. A common example is when a building or business does not have a ramp or access into their building by wheelchair. I can easily arrange to be in the company of people of my physical ability. If I need to move, I can easily be assured of purchasing housing I can get access to easily - accessibility is one thing I do not need to make a special point of looking for. I can be assured that my entire neighborhood will be accessible to me. I can assume that I can go shopping alone, and they will always have appropriate accommodations to make this experience hassle-free. I can turn on the television or open a newspaper and see people of my physical ability represented. When I learned about history, people of my physical ability were well represented. I was given curricular material which showed people like me as a role model. I can be assured that assumptions about my mental capabilities will not be made based on my physical status. I can swear, dress sloppily, or even be in a bad mood without people attributing it to my physical disability. I can do well in challenging situations very often without being told what an inspiration I must be to other able-bodied people. I have been asked to speak for all physically challenged people. Almost always, when asking to speak to the person in charge, will find someone of the same physical status. (May-Machunda, 2005) Physical Five Faces of Oppression (Young, 2000) References The Special Olympics strives to create a positive portrayal of people with disabilities in the media. The largest minority population in America is people with disabilities. They are also the poorest and least educated. (U.S. House of Representatives, 1990) In 2010, a new section was added to the Americans with Disability Act. All public pools are to add a lift making pools accessible. The application of this law has continuously been pushed out further, making the final date January 31st, 2013 for public pools to comply. Able-bodied Checklist How is life easier for me as a non-disabled person? Be Inspired! Psychiatric History of Oppression Legislation Cognitive (U.S. Senate, 1989) Oppression & Marginalization After researching, reading, and observing multiple videos, the most significant fact we discovered was that people living with disabilities are the largest minority group. We don't realize how much we take take for granted as able people. After working on this project, we see how Young's five faces of oppression are applied to people with disabilities. (Gorman, 2012) Beaulaurier, R. L. & Taylor, S. H. (2001). Social Work Practice with People with Disabilities in the Era of Disability Rights, Social Work in Health Care, 32:4, 67-91 Bowe, F. (1990). Employment and people with disabilities. OSERS News in Print, 3(3), 2-6 Disabled World News - Information and legal articles regarding Disability Discrimination in society including the workplace: http://www.disabled-world.com/disability/discrimination/#ixzz28dv9V965 Disabled World News - World health and disability statistics and facts including country and state population with disabilities: http://www.disabled-world.com/disability/statistics/#ixzz29I0ypuhQ Education of All Handicapped Children Act, Public Law 94-142 (1975). URL: http://www.venturacountyselpa.com/Portals/45/Users/Public%20Law%2094.pdf, Retrieved March 4, 2012. May-

online poster

Transcript: Use of cell phones Schuster So students can stop being so distracted on trying to sneak there phones in class and just put them to good use and learn with them. Why shouldent we use cellphones in class!!! Resources Why should we use cell phones? tinasia coleman 1:Lisa "finally ! Reasearch 2: proof that students use cell phones for learning. 3: The innovative. educator. Students use cell phones for learning any time they look up something on google or yahoo there learning something new. they learn so much with there phones they don't realize it and teachers and parents think the phones are sometimes distractions but there really not there just having fun and learning at the same time. https://aclu-wag.org/student-rights Because students can be more focused in class instead of trying to see a text message there friend sent them about shoes. so they can generally pay attention in class on the teacher. Most teachers and parents think that phones are a distraction there wright for some kids and adults they are but its a problem that can be fixed phones can be put to good use in class. 1: National research shows use of cell phones. 2: In class rooms students cant learn with the use of cellphones. 3: The State news 11/25/13 .web11/29/14 http://state news;com/article /2013/11/tuned-out. Nielsen Schools have an important duty to provide education for all students and students are responsible for school rules so schools remain a safe welcoming place for all students but pohones should be welcomed in class for education purposes they shouldn't be prohibited because someone is distracted they should be put to use in class. We shouldn't get rid of cell phones because technology is going to keep coming out with new phones and computers we should just put them to positive use starting in class. phones are awesome

Now you can make any subject more engaging and memorable