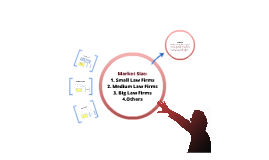
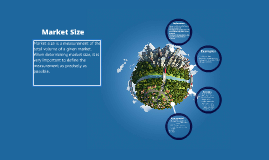
Size of market:
Transcript: British consumer tastes have been changing over recent years, interest has grown in exotic produce and uncommon varieties. This is partly due to the increased numbers of non-indigenous communities in the UK, particularly our urban areas. With new communities come outlets specific to produce from home territories, for example London's iconic Spitalfield's fresh produce market is now made up of 60% trading stalls sourcing Asian, Afro-Caribbean, African, Chinese and Egyptian fruit and vegetables. Currently the exotic fruit & veg. market in the UK is worth £422 million, having experienced a 3.8% growth in volume in the last year (Kantar Worldpanel Data). As trading between nations continues to increase and legislation continues to allow for smaller and smaller businesses to import fresh produce, the more readily available and cheaper these products will become. This may in turn have a negative impact on the value of home grown varieties as currently they are often seen as the 'cheaper option' in certain demographics. However the opposite may occur in other demographics who are more concerned with the environment, homegrown varieties may gain value when marketed as the 'greener' option, creating a niche market. Voluntary Initiative Scheme INPUTS QUALITY CONTROL /ASSURANCE POLITICAL The figures in this table show that the UK fruit industry is getting bigger, though it is still relatively small compared to the amount that is imported. By 2010 home produced fruit contributed to 12.1% of fruit consumed in the UK compared to 10.8% in 2007. This has likely been partly as a result of government initiatives to increase the amount of fruit produced and consumed locally. The value of UK produced fruit grew by a quarter over the four years, reflecting an increase in price. (However, growers, packers and nutritionists(!) will be concerned that total supply has fallen by 7.5% over the last four years) MANAGEMENT SYSTEMS During the 1990's British consumers were left scared and untrusting following a series of high profile food scares in the UK and Europe. In response to this many food assurance schemes were created as a way of advertising which foods were safe and reliable. This, however, caused more confusion as with so many different logos and slogans people were still unsure of what to buy. To combat this, Assured Food Standards was established to set one set of standards for people to look for, using the little red tractor as an indicator of these standards. Food producers/growers must ensure that the entire process is traceable and compliant with laws before they can label their product with the red tractor. This ensures the chemicals used are certified and approved, the transportation and distribution is at least as environmentally friend as possible, animals are treated according to legislation, hygiene and cleanliness are monitored and any additives/preservatives are approved and safe for consumption. Whilst it is not a legal requirement to be a member of the red tractor scheme, most major supermarkets prefer to trade with suppliers who are members. For this reason, Robin ensures Avonbank meets these standards and can put the logo to his product, Because, Putin. "Quality is the totality of features and characteristics of a product or service that bears its ability to satisfy stated or implied needs." - ISO 8402-1986 Because the UK is so dependent on fruit imports, the value of the pound compared to other currencies is critical to prices. Since the recession hit in 2008 the pound was has been very weak compared to the key 'fruit currencies' such as the euro, US$, South African Rand and Brazilian Real. A weak pound makes exports more affordable, but it makes imports more expensive. Last year (2013) has shown promising growth in the strength of the pound however; according to the Office for Budget Responsibility, the country's economy grew by 1.4% in 2013, up from the 0.6% it had been predicted. This is said to have been driven in part by an improving property market, increased consumption and greater bank lending as well as increased export orders. The strengthening pound should reduce the cost of imported inputs such as fuel and fertiliser, but it will also make UK exports more expensive on the world market. CUSTOMER BASE Robin has to employ stock rotation with the storage of his apples and pears in the small cold store that he has available to him. He stacks it and moves it around so that the first ones in are then the first ones out. This means that he can make the most of all the fruit he has. He also tries to minimise the amount of coming and going so the climate remains stable and requires less energy to keep cool. (He has a cap for keeping his face cool). Avonbank Fruit is a small business run by Robin Bickell, based at Pershore College. The orchards are 10 acres of mixed fruit, namely apples, pears and plums. In 2012 Robin produced and sold 54tonnes of fruit. This is more respresentative of his usual output than