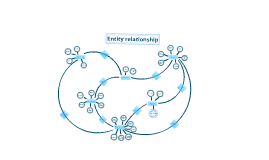
ENTITY-RELATIONSHIP DIAGRAM (ERD)
Transcript: (ERD) One instance of an entity (A) is associated with zero, one or many instances of another entity (B), but for one instance of entity B there is only one instance of entity A. For example, for a company with all employees working in one building, the building name (A) is associated with many different employees (B), but those employees all share the same singular association with entity A. An Entity Relationship Diagram is a graphical representation of an organization's data storage requirements. Entity relationship diagrams are abstractions of the real world which simplify the problem to be solved while retaining its essential features. In other words, entity relationship diagrams are graphical representations that illustrate the logical structure of databases. Relationship The relationship is the interaction between the entities. In the example above, the customer places an order, so the word "places" defines the relationship between that instance of a customer and the order or orders that they place. A relationship may be represented by a diamond shape, or more simply, by the line connecting the entities. In either case, verbs are used to label the relationships. 3. Many-to-Many one-to-one, expressed as 1:1; one-to-many, expressed as 1:M; and many-to-many, expressed as M:N. Cardinality 2. One-to-Many 1. One-to-One The three main cardinal relationships are: The steps involved in creating an ERD are: One instance of an entity (A) is associated with one other instance of another entity (B). For example, in a database of employees, each employee name (A) is associated with only one social security number (B). The three main components of an ERD are: Identify the data that must be captured, stored and retrieved in order to support the business activities performed by an organization; and Identify the data required to derive and report on the performance measures that an organization should be monitoring. ENTITY ENTITY-RELATIONSHIP DIAGRAM What are Entity Relationship Diagrams used for??? The entity is a person, object, place or event for which data is collected. For example, if you consider the information system for a business, entities would include not only customers, but the customer's address, and orders as well. The entity is represented by a rectangle and labeled with a singular noun. *Identify the entities. *Determine all significant interactions. *Analyze the nature of the interactions. *Draw the ERD One instance of an entity (A) is associated with one, zero or many instances of another entity (B), and one instance of entity B is associated with one, zero or many instances of entity A. For example, for a company in which all of its employees work on multiple projects, each instance of an employee (A) is associated with many instances of a project (B), and at the same time, each instance of a project (B) has multiple employees (A) associated with it. The cardinality defines the relationship between the entities in terms of numbers. An entity may be optional: for example, a sales rep could have no customers or could have one or many customers; or mandatory: for example, there must be at least one product listed in an order. There are several different types of cardinality notation; crow's foot notation, used here, is a common one. In crow's foot notation, a single bar indicates one, a double bar indicates one and only one (for example, a single instance of a product can only be stored in one warehouse), a circle indicates zero, and a crow's foot indicates many. ENTITY-RELATIONSHIP DIAGRAM