You're about to create your best presentation ever

Dashboard Presentation Template

Create your presentation by reusing one of our great community templates.

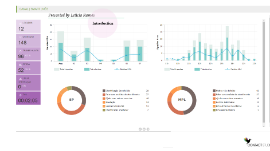
Presentation DASHBOARD

Transcript: Presented by Leticia Ramos Introduction Objective This dashboard was made to show results of an IVR (Interactive voice response) operation on an Call Center Data science is an interdisciplinary field that uses scientific methods, processes, algorithms and systems to extract knowledge and insights from data in various forms, both structured and unstructured. Data science is a "concept to unify statistics, data analysis, machine learning and their related methods" in order to "understand and analyze actual phenomena" with data. It employs techniques and theories drawn from many fields within the context of mathematics, statistics, information science, and computer science. Database A database is an organized collection of data, stored and accessed electronically. Database designers typically organize the data to model aspects of reality in a way that supports processes requiring information. A database-management system (DBMS) is a computer-software application that interacts with end-users, other applications, and the database itself to capture and analyze data. (Sometimes a DBMS is loosely referred to as a "database".) A general-purpose DBMS allows the definition, creation, querying, update, and administration of databases. A database is generally stored in a DBMS-specific format which is not portable, but different DBMSs can share data by using standards such as SQL and ODBC or JDBC. Dashboard A dashboard is an information management tool that visually tracks, analyzes and displays key performance indicators (KPI), metrics and key data points to monitor the health of a business, department or specific process. They are customizable to meet the specific needs of a department and company. Behind the scenes, a dashboard connects to your files, attachments, services and API’s, but on the surface displays all this data in the form of tables, line charts, bar charts and gauges. A data dashboard is the most efficient way to track multiple data sources because it provides a central location for businesses to monitor and analyze performance. Real-time monitoring reduces the hours of analyzing and long line of communication that previously challenged businesses. Programming language A programming language is a set of commands, instructions, and other syntax use to create a software program. Languages that programmers use to write code are called "high-level languages." This code can be compiled into a "low-level language," which is recognized directly by the computer hardware. Data scientist A person employed to analyze and interpret complex digital data, such as the usage statistics of a website, especially in order to assist a business in its decision-making. Python is an interpreted high-level programming language for general-purpose programming. Created by Guido van Rossum and first released in 1991, Python has a design philosophy that emphasizes code readability, notably using significant whitespace. We start with a date treatment, the process of this treatment clear all the accumulated data every first day of the month, that’s because the dashboard was made to show monthly results of an IVR (Interactive voice response) operation. Keywords in Python programming language We cannot use a keyword as variable name, function name or any other identifier. They are used to define the syntax and structure of the Python language. In Python, keywords are case sensitive. There are 33 keywords in Python 3.3. This number can vary slightly in course of time. All the keywords except True, False and None are in lowercase and they must be written as it is. After that we create a function that we can identify on the code beginning with the reserved word def, this function treat a specifically field on our available data that came in seconds, as we can see we use “format” to return this seconds in a structure that is more pleasing to the human eyes and easier to understand without mathematical calculations. We also created a def to remove outliers, means the values that take of the values that is out of the line, like too big and little values. The next def returns the quantity of head count, the number of agents that are logged on the platform To measure and sum all the data available, we perform a query to the CASSANDRA database, also within a function. We define dictionaries where we will store the totals returned from the query and call the function created data_date, storing it in a single variable we start to scan the result of this variable with a loop "FOR"and store the contents separately in new variables we add the totals returned in each dictionary previously defined with the "setdefault" method In this part of the code we access the totals of each setdefault and separate them to fill in all the boxes We do the same with the data from the screw chart And finally, in the variable "data", we leave everything in a dictionary accessible for the front end to work with the data at the time of creating the dashboard A bit of

Dashboard Presentation

Transcript: • "Logi Info has been a game-changing platform for us. I was able to create cohesive app and we now have happier customers and are delivering more product." Brian Hanley, Sr. Applications Programmer, Gopher Resource Case Study & Live Demo Welcome Why Business Intelligence? Why Logi Analytics? Case Study & Live Demo Questions Why Logi Analytics? What will you create? Easily access any type of data (Database, XML file) No complex data models Reduce time and effort Why BI? No per user fees Flexible licensing model for unlimited end users and for all deployment needs Offer a free, 15-day, fully functional trial license for new users Unified platform allows all components work together seamlessly Easy to maintain and manage even the most advanced BI projects Connect to Any Data Source The New York Mets executive team is in need of a dashboard analytics solution to better understand merchandise sales around the country. In addition, they would like to focus on the top selling products and customer demographics to develop a promotional campaign to increase sales. Our Customers Love Us! Users can start building dashboards and reports in days Code-free way to create dashboards and reports Eliminate Guesswork Historical Data, Real Time Data Accurate Forecast Quickly Identify Trends Excel Spreadsheets are obsolete find outliers within seconds Improve Efficiency/Streamline Operations Do more with less Higher productivity + Reduce Costs=Success! Fast & Easy to Use Great Value Pain Points All reports are in excel today. Static reports with no interactivity. Need better visuals Ease of use Self Service From www.logianalytics.com Questions? Easy to Manage Fast and Easy to Use Connect to Any Data Source Great Value Easy to Manage Our Customers Love Us! Agenda

Dashboard presentation

Transcript: Vision 2020 Know-How Rework of Intranet Search functionality Know-How system Milestones this period : Budget approval for pilot Milestones next period : Scope and approach for pilot agreed Workflow Upgrade Milestones this period : Function Booking Form (FBF) development complete New production environment installed Milestones next period : FBF live CMI workflow analysis complete Desktop Upgrade Milestones this period : Exchange Design and Migration plan agreed Exchange Hardware installed in NY and NH Test extract of archive email for import to Mimecast Windows 8 requirements document issued Microsoft licence agreement Milestones next period : Mimecast Import Windows 8 design agreed Exchange pilot / live in NY Office and Data Centre Moves New Haven : Delayed - date tbc Reworking plans to use an off-site data centre Would allow equipment already ordered for the move to be installed and used now Hong Kong : Will be before NH move. ( September ? ) Equipment to be moved to an off-site data centre in advance EU Data Centre : Agreeing contract with preferred supplier Network design agreed Project managers appointed yuiop Design & Build May Optimises traffic and provides security Pilot Oct Apr The VDI design …. Aug Links user to their desktop and applications Design & Build Each work stream has a full requirements/design cycle – no assumptions Exchange upgrade – straightforward technology upgrade to latest version, taking opportunity to move from Enterprise Vault to Mimecast Desktop upgrade – likely to be far more radical, with heavy use of VDI ( next slide) Remote access – a variant of the desktop Lync 2013 – at early design stage, but again, likely to use VDI Deploy chosen consultants could not start for 4 weeks + mimecast deliberation Feb average per day orange line = oustanding/backlog much of backlog are bookings / service requests / new joiners we don't 'feel' as busy as last summer Testing All Applications (200+) Project Aims / benefits ( all from the PID ) Resources and approach - Technology 2013 The Desktop Upgrade Project consists of several work streams Replacing Windows XP with Windows 8 Replacing Office 2003 with Office 2013 Testing and Replacing all other Applications Replacing Remote Access System Replacing the Email System and Introducing Mimecast Archiving Implementing Lync 2013 Sept in the data centre Jun Aim : we use lots of metrics to manage ourselves to report some of those metrics to a wider audience to give a better understanding of what we are doing to make us more accountable to get ideas on what you might want reported / find interesting Agenda : projects services resources Deploy Service As now – databases and fileshares Design & Build in the data centre Design & Upgrade to Office 2013 Implement Lync 2013 Upgrade Remote Access user device ( PC) A 'Major Incident' is a service failure that impacts users (even if it is just one or two) MIs reflect the age of our systems, their complexity and how well we run them We want to drive down MIs and to do this we concentrate on understanding what caused the problem - and doing something about it Improved PC boot times and login times, Improved performance of Outlook and FileSite, where possible, Improved desktop stability, including improvements in the configuration and reliability of user profiles, Most common issues on current Snag List to be addressed, where possible, Consistent user experience in “home” offices, when travelling to other offices, and when working remotely, Clear and streamlined process with better performance for visitors logging on in remote offices, Faster turnaround for the rebuild of PCs and installation of applications through reduced imaging time and minimal manual intervention, Location aware printing, such that the default printer is automatically detected based on the physical location of the PC, thereby avoiding issues with users printing to their “home” office printer when working in an alternative location, Fully supported versions of the desktop operating system, Microsoft Office applications and back-end email (Exchange) infrastructure. Deployment of Lync 2013 unified communication platform and the adoption of Instant Messaging and Presence as business tools. Mar Sketches Projects started to include US stats Deploy Workstreams IT department - dashboard Management of resources Deploy IT Projects a bit hard to track / average Martin H left 'lost' Craig W to Windows project took a while to get backfill About to get a second student Runs the desktop or application Stores the desktop and application Pilot Jul Design & Build BTT 2014 Test & Upgrade global training stats : peaks during rollouts currently ~ 2.5 trainers lots of 1:1 training expenditure against budget Upgrade Email to Exchange 2010 Timescales User device - Runs Citrix receiver Nov Deploy Design & Build Vision 2020 filesite rollout 16 OB power outage New Haven Move Whitehill billing replacement SCCM software distribution (IT) Concep electronic mailshots user

Dashboard Presentation

Transcript: SASHAKTA BHARAT ABHIYAAN The campaign's objective is to eliminate poverty through a government-community collaboration model, involving citizens, businesses, political leaders, NGOs, and the media. 1 Educate about government schemes & polices. WHY? OBJECTIVES 2 Upliftment of underprivileged families through a helping hand and supervising body. 3 Boost confidence to achieve goals & provide a platform to improve standard of living. WHAT? PLATFORM & IT'S WORKING A block-chain based gaming model backed by a one stop platform that uses data and AI to provide solutions. The historical data is used to set goals for Family B which is tracked and a progress chart is made. Scores for each area of improvement gives an insight into future possibilities and diagnoses a guide. E-Mitra and Family A are in constant loop of operations. Features Features 1. Real time data mined, processed and observed for predictions and diagnoses. 2. App-based interaction with constant evaluation and feedback. 3. Growth into independent individuals keeping in mind practical problems faced and a medium to overcome those challenges. HOW? WORKING Dashboards A user-friendly model that focuses on major setbacks and gradually uplifts the community as whole. Scoring System Education Education Dashboard Mindset: E-Mitra gets an approach for holistic development of student through: Assessing elements such as evaluation, activities, skills, events, community service, work sample, goal setting, well-being. Teacher's feedback daily on performance Parents being allowed to contact support, ask queries and give feedback on performance. Happiness quotient that determines the trustworthiness of the school and acts as an accreditation. Visuals Role of parties Role of parties Family A Family B E-Mitra Family A can help by donating their books, resources and giving feedback directly to Family B. Family A acts as additional assistance to E-Mitra such as setting up a meeting with Family B. If the student becomes eligible for Bihar Free Laptop Yojana, the E-Mitra can inform Family B. Schemes Schemes Mid-Day Meal Scheme Maha Right to Education Beti Bachao Beti Padhao The ‘Transformation of Aspirational Districts’ Programme Career Career Dashboard Mindset To help people match their skills and career options Mapping the talent and skills to provide insight into the best course of action and suitable employment prospects in future. Steps to train in a particular skill Video learning, books, interview preparations guides, tests and sample answers are provided. Prospect career options based on skills and probability of achieving them. Visuals Role of parties Role of parties Family A Family B E-Mitra Family A can offer employment to Family B looking at the dashboard. E-Mitra can alert the family if they ignore any opportunity that is present to them. A and E-Mitra can have a discussion and come to a conclusion that benefits B. Schemes Schemes Mahatma Gandhi National Rural Employment Guarantee Act (MGNREGA) Deen Dayal Upadhyaya Grameen Kaushlya Yojana CM Solar Pump Scheme Prime Minister’s Employment Generation Programme Finance Finance Dashboard Mindset: To reach financial independency on basis of: Present financial status and expected estimates of a family based on goals Elements like loans, investments, past loans and investments for easier access. Current status of finances through numerical data such as savings rate, net worth, liabilities, insurance coverage, sustainability, emergency fund, etc. Video tutorial to understand basic functioning, rules, procedures, assistance. Local financial advisor to discuss current lifestyle and expenses. Financial independency score as an integration. Visuals Role of parties Role of parties Family A Family B E-Mitra Family A can advice on which stocks to trade in and educate about financial markets additionally. A and E-Mitra can have a discussion and setup a financial education drive in different cities. If the gap between expected financial status and current financial status is too big, E-Mitra must take quick action and alert the family. Schemes Schemes Pradhan Mantri Jan Dhan Yojana Pradhan Mantri Kisan Samman Nidhi Mega Pension Scheme Pradhan Mantri Kisan Pension Yojna PM MUDRA Yojna Atal Pension Yojn PM Jeevan Jyoti Bima Yojna CM Viklaang Pension Scheme Maha Vidhwa Pension Yojna 2021 Maharashtra National Old Age Pension Schem Medical Medical Dashboard Mindset: One stop for all medical resources nearby. Availability of medical resources. Location of clinics, the policies offered and support in need of emergency. Health records, booking appointments, emergency call, etc. Information on hospitals, pharmacy, vaccination and their centers, old age home, blood banks, therapist, rehab, veterinarian, toilets, meal (langar) centers, etc. Visuals Role of parties Role of parties Family A Family B E-Mitra In need of blood, A can contact a much larger community in his inner circle and reach B faster. B can contact E-Mitra for any emergency

Now you can make any subject more engaging and memorable