Fishbone Diagram
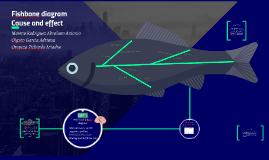
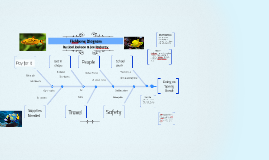
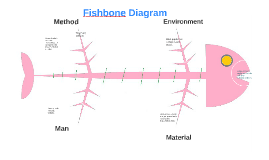
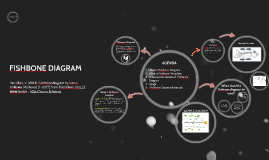
Transcript: What it looks like Fishbone Diagram Classic fishbone diagram Analyze your diagram. By this stage you should have a diagram showing all the possible causes of your delay / problem. Depending on the complexity and importance of the problem, you can now investigate the most likely causes further. This may involve setting up interviews (see getting patient perspectives), carrying out process mapping or surveys which you can use to decide whether the causes identified are correct. Take each of the main categories and brainstorm possible causes of the problem. Then, explore each one to identify more specific 'causes of causes'. Continue branching off until every possible cause has been identified. Where a cause is complex, you might break it down into sub-causes. Show these as lines coming off each cause line. Patient Re-admission Process-type cause and effect diagram Firstly, identify the problem. Write it in a box and draw an arrow pointing towards it. Think about the exact problem in detail. Where appropriate, identify who is involved, what the problem is, and when and where it occurs. CONTD.... A cause and effect diagram, also known as an Ishikawa, and it is a graphic tool used to explore and display the possible causes of a certain effect. It helps to identify areas for improvement. When causes group naturally under the categories of Materials, Methods, Equipment, Environment, and People Classic Diagram FISHBONE DIAGRAM Visually explanation To show causes of problems at each step in the process. It graphically displays the relationship of the causes to the effect and to each other. When you need help fully understanding an issue and to identify all the possible causes - not just the obvious. If you know the cause of the delay, you are then better placed to implement the solution. Variety of benefits Teach-a-tool It helps teams understand that there are many causes that contribute to an effect Solutions Identify the major factors and draw four or more branches off the large arrow to represent main categories of potential causes. Categories could include: equipment, environment, procedures, and people. Make sure that the categories you use are relevant to your particular problem / delay. When is it used Application to the real world How is it created? Process-type cause and effect diagram Creates a clear understanding