You're about to create your best presentation ever

Best Free Powerpoint Template For Data Classification

Create your presentation by reusing a template from our community or transition your PowerPoint deck into a visually compelling Prezi presentation.

Data Classification

Transcript: Mean-Standard Deviation Specialized type of isarithmic map (contour map) in which the sample points are associated with enumeration units Used when data is collected for smooth continuous phenomenon Requires standardized data Proportional Symbol You can also view the presentation as a whole by clicking the Home button... and zoom in and out using the mouse wheel or the zoom buttons. How do I choose? Can be a function of what is available to the mapmaker and their knowledge Assumption is that your software is capable of performing the calculations There is NO single best method of classification Consider the purpose of the map and the knowledge of the audience Tutorial Quantile One dot is set equal to a certain amount of phenomenon and dots are placed where it is most likely to occur What you are mapping may actually cover an area, but it is represented as located at points. Requires collecting additional information about where the phenomenon might occur Mean-Standard Deviation/Maximum/Natural Break There are 6 common methods of data classification Equal interval Quantile Mean-standard deviation Maximum breaks Natural breaks Optimal Slides Symbolization Equal Interval Common methods of data classification Dot Map Issues with using a Quantile classification scheme Natural Breaks Measurement Quantile Class breaks are determined by dividing the range (difference between the lowest and highest valued units of data) into desired number of equal-width class intervals. Many institutions and government agencies use this method to map complex spatial patterns. Maps are easy to understand and interpret. Choosing a Method Equally divides the total number of values into the desired number of classes Commonly used divisions are quartiles (4 categories) and quintiles (5 categories). Optimal/Choosing a Classification Audio Clips Data Calculation Steps Compute the number of observations in a class Divide the total number of observations by the number of classes Place your calculated number of observations in each class Identical data values should not be places in different classes so ties can result Adjust your class break to compensate Maximum Breaks Advantages Considers in detail how data are distributed along the number line Can help determine the number of classes needed Disadvantages Concept is hard to understand Gaps in the legend Note: Depending on the dimensions of your screen, these arrows might be pointing at nothing! Quantile Maximum Breaks You can click on text, images, or slides to zoom directly to them. Manually zooming to text and images will not interrupt the audio, but clicking on items will pause audio. Optimal Qualitative vs Quantitative Choropleth Quantile vs Equal Interval Mean-Standard Deviation Advantages Calculation can be completed by calculator Intervals will usually be easy for the map reader to interpret Legend limits will contain no gaps or missing values Disadvantages Class limits do not consider how data is distributed along the number line Considerations Compare the same data portrayed with both classification methods Hold down the left mouse button to pan around the presentation. Optimal Symbolization Isopleth Created by Cynthia Brewer and Trudy Suchan - this map used meaningful breaks, rounded breaks, and identical breaks across a whole set of maps Quantile Choropleth Use this button if you accidentally pan or zoom into nothingness. (Or after clicking the Home button in the next step. To return to the previous slide, click the left arrow, found at the bottom-center of the screen. As the audio plays, you can pan and zoom around the presentation. The audio will only end if: you press the pause button you go to the next slide or it runs to the end Natural Breaks Data Classification Quantile classification never will never have empty classes, or classes with just a few values BUT they can place similar values in different classes or very different values in the same class! Equal Interval Scaling symbols in proportion to the magnitude of data occurring at point locations Can by true or conceptual points Used to display raw totals Commonly used to portray data collected for enumeration units (i.e. counties or states) Data is grouped into classes and a color is assigned to each class Appropriate when data values change abruptly at enumeration unit boundaries 2000 Census Atlas Classes are formed be repeatedly adding or subtracting the standard deviation from the mean of the data Advantages Does consider how data are distributed along the number line If data is normally distributed the mean can serve as a useful dividing point There are no gaps in the legend to confuse readers Disadvantages Only works well with data that is normally distributed Required basic understanding of basic statistical concepts Most slides in this presentation include audio clips of the lecture material. If you place your mouse at the bottom of the screen you will see the playback controls. Press play and pause to

Data classification

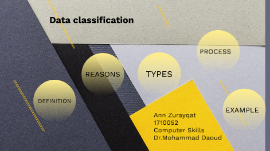
Transcript: Ann Zurayqat 1710052 Computer Skills Dr.Mohammad Daoud Data classification A DEFINITION OF DATA CLASSIFICATION DEFINITION Data classification is broadly defined as the process of organizing data by relevant categories so that it may be used and protected more efficiently. On a basic level, the classification process makes data easier to locate and retrieve. Data classification is of particular importance when it comes to risk management, compliance, and data security. Data classification involves tagging data to make it easily search-able and track-able. It also eliminates multiple duplications of data, which can reduce storage and backup costs while speeding up the search process REASONS FOR DATA CLASSIFICATION REASONS Data classification has improved significantly over time. Today, the technology is used for a variety of purposes, often in support of data security initiatives. But data may be classified for a number of reasons, including ease of access, maintaining regulatory compliance, and to meet various other business or personal objectives. In some cases, data classification is a regulatory requirement, as data must be searchable and retrievable within specified timeframes. For the purposes of data security, data classification is a useful tactic that facilitates proper security responses based on the type of data being retrieved, transmitted, or copied. TYPES OF DATA CLASSIFICATION TYPES Data classification often involves a multitude of tags and labels that define the type of data, its confidentiality, and its integrity. There are three main types of data classification that are considered industry standards: Content based classification inspects and interprets files looking for sensitive information Content based classification looks at application, location, or creator among other variables as indirect indicators of sensitive information Context Context based classification depends on a manual, end-user selection of each document. User-based classification relies on user knowledge and discretion at creation, edit, review, or dissemination to flag sensitive documents. User User THE DATA CLASSIFICATION PROCESS PROCESS Data classification can be a complex and cumbersome process. Automated systems can help streamline the process, but an enterprise must determine the categories and criteria that will be used to classify data, understand and define its objectives, outline the roles and responsibilities of employees in maintaining proper data classification protocols, and implement security standards that correspond with data categories and tags. When done correctly, this process will provide employees and third parties involved in the storage, transmission, or retrieval of data with an operational framework. An organization may classify data as Restricted, Private or Public. In this instance, public data represents the least-sensitive data with the lowest security requirements, while restricted data is in the highest security classification and represents the most sensitive data. This type of data classification is often the starting point for many enterprises, followed by additional identification and tagging procedures that label data based on its relevance to the enterprise, quality, and other classifications. The most successful data classification processes employ follow-up processes and frameworks to keep sensitive data where it belongs. AN EXAMPLE OF DATA CLASSIFICATION EXAMPLE

powerpoint template

Transcript: Nobody knows babies like we do! Quality products . Good Customer service. Every Kid really loves this store.. BABYLOU ABOUT US About Us BabyLou was established in 2004. It has been more than a decade since we started, where we have ensured to take care of every need and want of every child and infant under one roof, true to the caption “NO BODY KNOWS BABIES LIKE WE DO”. Our benchmark is to provide 100% customer service and satisfaction and continue to deliver the same with a wide range of toys, garments and Baby Products. Play and Create We Are Best 01 02 03 Block games Building Blocks help Kids to use their brain. PLAY TO LEARN in Crusing Adventures Our Discoveries Enjoy a sunny vacation aboard a luxury yacht with the LEGO® Creator 3in1 31083 Cruising Adventures set. This ship has all the comforts you need, including a well-equipped cabin and a toilet. Sail away to a sunny bay and take the cool water scooter to the beach. Build a sandcastle, enjoy a picnic, go surfing or check out the cute sea creatures before you head back to the yacht for a spot of fishing. Escape into the mountains Disney Little Princes in Also available for your Babies..... Also... Out of The World… Our reponsibility BABYLOU…. Our Responsibility All children have the right to fun, creative and engaging play experiences. Play is essential because when children play, they learn. As a provider of play experiences, we must ensure that our behaviour and actions are responsible towards all children and towards our stakeholders, society and the environment. We are committed to continue earning the trust our stakeholders place in us, and we are always inspired by children to be the best we can be. Innovate for children We aim to inspire children through our unique playful learning experiences and to play an active role in making a global difference on product safety while being dedicated promoters of responsibility towards children.

Now you can make any subject more engaging and memorable