You're about to create your best presentation ever

Bcg Presentation Template

Create your presentation by reusing one of our great community templates.

BCG

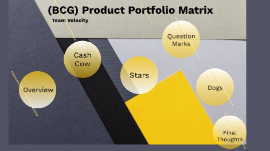
Transcript: One of the dimensions used to evaluate business portfolio is relative market share. Higher corporate’s market share results in higher cash returns. This is because a firm that produces more, benefits from higher economies of scale and experience curve, which results in higher profits. Nonetheless, it is worth to note that some firms may experience the same benefits with lower production outputs and lower market share. High market growth rate means higher earnings and sometimes profits but it also consumes lots of cash, which is used as investment to stimulate further growth. Therefore, business units that operate in rapid growth industries are cash users and are worth investing in only when they are expected to grow or maintain market share in the future. Dogs hold low market share compared to competitors and operate in a slowly growing market. In general, they are not worth investing in because they generate low or negative cash returns. But this is not always the truth. Some dogs may be profitable for long period of time, they may provide synergies for other brands or SBUs or simple act as a defense to counter competitors moves. Therefore, it is always important to perform deeper analysis of each brand or SBU to make sure they are not worth investing in or have to be divested. Strategic choices: Retrenchment, divestiture, liquidation Developed by the Boston Consulting Group in the early 1970s, the BCG Matrix is a tool used to assist firms in determining how to allocate their resources in relation to product lines. Although the BCG matrix was designed to be used with products lines, it has applications for a variety of other settings. Presented by Ms.Tidarat Jariyakul 57123442162 Ms.Rawinnipha Daengsoemsiri 57123442166 Ms.Thanwa Ni-arvorn 57123442169 Ms.A-pissara Rongkaew 57123442178 Ms.Rojareck Rujireck 57123442179 Ms.Ploymanee Somnoi 57123442182 There are four quadrants into which firms brands are classified Market growth rate Stars Relative market share Cash cows are the most profitable brands and should be “milked” to provide as much cash as possible. The cash gained from “cows” should be invested into stars to support their further growth. According to growth-share matrix, corporates should not invest into cash cows to induce growth but only to support them so they can maintain their current market share. Again, this is not always the truth. Cash cows are usually large corporations or SBUs that are capable of innovating new products or processes, which may become new stars. If there would be no support for cash cows, they would not be capable of such innovations. Strategic choices: Product development, diversification, divestiture, retrenchment THANK YOU FOR YOUR ATTENTION Stars operate in high growth industries and maintain high market share. Stars are both cash generators and cash users. They are the primary units in which the company should invest its money, because stars are expected to become cash cows and generate positive cash flows. Yet, not all stars become cash flows. This is especially true in rapidly changing industries, where new innovative products can soon be out competed by new technological advancements, so a star instead of becoming a cash cow, becomes a dog. Strategic choices: Vertical integration, horizontal integration, market penetration, market development, product development Question Marks BCG growth-share matrix Cash Cows Dogs Question marks are the brands that require much closer consideration. They hold low market share in fast growing markets consuming large amount of cash and incurring losses. It has potential to gain market share and become a star, which would later become cash cow. Question marks do not always succeed and even after large amount of investments they struggle to gain market share and eventually become dogs. Therefore, they require very close consideration to decide if they are worth investing in or not. Strategic choices: Market penetration, market development, product development, divestiture

BCG

Transcript: Team Velocity (BCG) Product Portfolio Matrix What is BCG? The BCG Matrix classifies an organization’s business units according to its cash usage and cash generation using market growth and relative market share. Overview Why use it? Why use it? The BCG (Growth Share) Matrix provides meaningful way to visually assess a company’s product portfolio position The Matrix The Matrix Not this kind, but just as cool... This Kind The "real" Matrix Example Cash Cow Cash Cow Manage for Earnings Low cash usage + high cash generation = high ROI Established market + good cash generation Typically market leaders Little additional growth / large amount of cash not required to maintain dominant position Maturity stage of product life cycle Overview Explained Examples Example Careful management required to maintain market position Further investment can obtain additional growth Promotion campaigns should be aimed at differentiation and maintaining or increasing brand awareness Objectivies & Strategies Objectives & Strategies In the News Stars Stars Invest for Growth Overview Explained Leaders in the business High cash generation, but high cash usage = ROI Greater potential to generate cash, but expensive to maintain position Require great deal of investment (R&D, promotion, operating costs) Growth stage of product life cycle HIGH GROWTH, HIGH MARKETSHARE! Objectives and Strategies Objectives & Strategies Additional investment should be a priority (promotions, R&D, market research) Marketing programs should be aggressive with high level selling, advertising, pricing, and sales promotion activities to hold marketshare, otherwise the star will become a cash cow Examples Golden Example Example Question Marks Question Marks Opportunistic Development High cash usage + low cash generation = Low ROI Not yet achieved dominant market position High growth potential (may require $$$) Brand or lines may be unpredictable in the market Also known as .... Overview Explained "Problem Children" Problem Children "Wild Cats" Wild Cats Examples Should target for selective investment Potential to move to Star quadrant with careful management, potential to fall into dog quadrant Marketing Strategy: identification of niche or emerging market segments Objectives & Strateties Objectives & Strategies Example Harvest or Divest Dogs Dogs Overview Explained Low cash usage + low cash generation = Low ROI Often have little future (low relative market share / low growth potential, drain on cash reserves) Brands / lines should be harvested or divested (deleted from product portfolio) Examples Objectives & Strategies Objectives & Strategies Selectively harvest or sell to smaller businesses as niche market products Improve production / distribution methods to gain cost savings Identify / exploit niche growth market segments Divest by minimizing marketing expenditure and deleting items Examples Examples Example Poll Final Thoughts Thank You!

BCG Presentation

Transcript: 1.54 Million Jews in New York Metro Area (largest concentration in US) Majority secular, growing Orthodox/Haredi populations UJA Survey - 83% of surveyed families gave to charity in 2010 70% - Non-Jewish causes 59% - Jewish organizations Wide range of services including: Human Services International Support Jewish policy organizations Kiruv/Outreach Organizations Federation Giving Community Needs 1. I feel passionately about the cause 2. Makes me feel like I am making a difference 3. Knowing someone who would benefit from the charity 4. Feels like the 'right' thing to do 5. Fulfills my obligation to give tzedakah Important facts that will help further research: Secular & Observant Jews have similar values Observant Jews learn more about giving from Rabbis and Jewish teachings, while secular Jews learn from more 'secular' avenues 4. Do the the motivations, influences and types of organizations young Jews support vary by religiosity? Current Beliefs Judaism & Philanthropy Background Reform Major Concepts of Philanthropy in Judaism: Haredi Motivations Survey Results! Modern Orthodox Chesed - acts of loving kindness (voluntary) Tzedakah - justice or righteousness (obligatory) Young Jewish giving is NOT a simple topic! Methodology Young Jewish Philanthropy The giving habits of secular and observant Jews living in the New York Metro area between the ages of 18-35 are greatly influenced by Jewish thought and traditions, and serve as a driving force behind both Jewish and non-Jewish giving. Conclusions Jewish Philanthropy in NYC % of Giving to Jewish vs. Secular causes: Statistics 498,000 people under 25 in New York Metro area In UJA study, 53% of participants between the ages of 18-34 reported giving to charity in 2011. Young Jews are more likely to give to only Jewish or only non-Jewish causes. Preliminary Findings 1. Was the sample 'too close' or too small? Is the Jewish community becoming more 'integrated' or are Jewish beliefs fluid? 2. What factors may contribute to the differences & similarities between the denominations? 3. How can better questions be asked to truly gauge views on giving? Orthodox over twice as likely to support Jewish & Israeli/Zionist organizations 1. What influences young Jews' thoughts on charitable giving? 2. What motivates young Jews to give? 3. What types of organizations do they support? Causes Jews of all denominations tend to give to causes they find important, and they find in line with their perception of giving values within Judaism. Review questions on survey handout Demographics Judaism is both a religion & cultural framework Influences 1. There is less distinction between observant & secular giving than originally thought. 2. Israel is important to both secular & religious Jews, but does not receive a significant percentage of giving. 3. The idea of tzedakah is a central tenant in young Jewish giving. 4. Religious and Jews give through similar channels, Financial Support & attending events, though secular Jews are more likely to be involved with an organization. Conservative Reform Upbringing vs. Modern Orthodox 1 Jew, 3 Opinions: Diaspora Anti-Semitism & Self-Containment Target Population: Jewish Americans living in the New York Metro area between the ages of 18-35. Dissemination of survey: Social Media, e-mail, Jewish networks Sample Size: 46 Created by SoGo Survey Background Data Questions Thesis Jewish Community: Secular: 34% / Observant: 55% Israel: Secular: 10% / Observant: 20% Secular Causes: Secular: 55% / Observant: 20% Gender Female: 29 (61.7%) Male: 18 (38.3%) Age 18-22: 2 (4%) 27-30: 14 (29%) 22-26: 26 (32%) 31-35: 5 (10%) Education Some College/In College: 2 (4%) Bachelors: 20 (42%) Masters: 21 (44%) Doctorate: 4 (8.5%) Income <50K - 23 >100K - 10 50 - 100K - 12 N/A - 2 Marital Status Single: 75% / Divorced: 2.13% Married: 10.6% / With Kids: 12.77% Findings Every participant chose some form of Jewish giving (not Israel) Popular secular causes: Health, Education, Human Services Secular giving: Similar spread between secular & observant groups Jewish giving: secular Jews support policy organizations. Jewish Community: 43% secular vs. 73% observant Israel: 52% secular vs. 60% observant Top 5 Reasons for Giving to Charity: Major Differences: Interpretations of the Torah Observance of Sabbath, Dietary Laws, Family Laws Lifestyle Differences Philanthropy in NYC Youth Philanthropy Young Professional 'Scene' Board & Organizations Denominations of Judaism Additional Findings 48 Respondents Survey Questions Giving among Young Jewish Professionals in New York Top 4 influences: Family Traditions, Friends, Jewish Community & Tzedakah Top Secular Influences: Family & Friends (tie) Concept of Tzedakah Current Events Top Observant Influences: Jewish Community Family & Concept of Tzedakah (tie) Current Events & Friends (tie) Influences nearly the identical for secular and observant upbringings, with those with observant upbringings far more likely to be influenced by rabbis and

Now you can make any subject more engaging and memorable