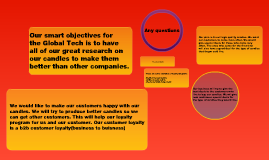
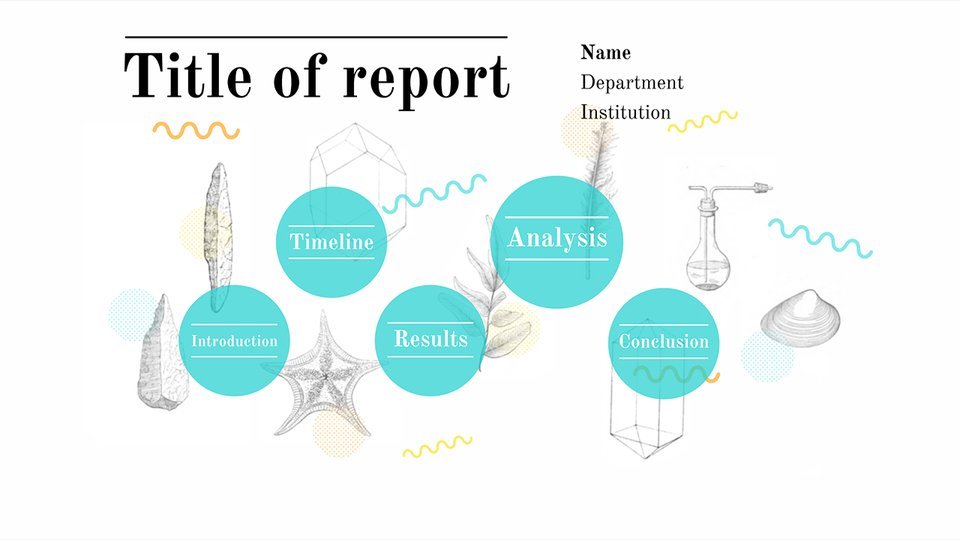
PRESENTATION OUTLINE:
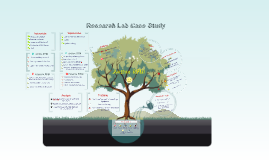
Transcript: Let’s imagine... AQ model Paul G. STOLTZ 1997 AQ- Group 4 Presentation (b) Nick Vujicic WHAT IS AQ? Intelligence-Adversity Quotient Figure 1: AQ as the determining Variable in hope and control If individuals have low AQ and therefore Lack the ability to withstand adversity, they will remain stunted in their potential. The messages I want to send you today... Great Speaker E=mc2 E=effective service leadership m=moral character c=caring c=competence Higher AQ people have the ability to feel "this too shall pass," and go on. Lower AQs see adversity as dragging on indefinitely When things go wrong you've got to "pick yourself up, dust yourself off, and start all over again.“ Juicy company crisis Event turnaround: Cancel old products Existing and future products repositioning PRESENTATION OUTLINE: Conclusion The relationship between Service Leader & AQ Low AQ (8-18) indicates that you have a difficult time dealing with adversity, and/or adversity takes an unnecessary toll on your energy, performance and spirit. Strengthening your AQ can improve your natural resilience and lessen the fallout from adversity. Moderate AQ (19-31) indicates you deal with adversity fairly well, however your performance can be enhanced with a higher AQ. High AQ (32-40) indicates a high tolerance for adversity and the ability to persevere through changing times. You may be strengthened by adversity, especially over time. You probably embrace the right kind of change and take necessary risks. Source: PEAK Learning Inc. How does AQ relate to Service Leadership? People with high AQs perceive themselves as having more control and influence in adverse situations than those with lower AQs High AQs invariably find or interpret some part of the situation to be under their control. Low AQs usually give up A high AQ worker tries to learn from the mistake and believes the next project will be better Add together all the numbers you circled to get your overall AQ..... 1) What is AQ? 2) How AQ model and theory affect our behavior 3) Articles : Importance of AQ 4) Practical case 5) AQ test questionnaire 6) Suggestion toward AQ Microsoft in the 1990s Being able to cope and bounce back successfully in face of personal setbacks Open software programs independent of operating systems Their ability? Their talent? Or simply their smile? When you confirm some challenges, not only your ability determines the way to deal with the problems, but also your AQ counts Adaption Event turnaround Pull off products Claim responsibility Establish safety testing program Bounce back AQ is one of the most important requirements to become a successful service leader Now you have 2 mins to do the test! Figure 2: The tree of success AQ Plays the foundation role in unleashing all Aspects of our life long Potential, no matter how Hard the wind may blow. As the nutrient of soil, AQ is a foundation component which affects our lately developed talent and intelligence, which subsequently affect our performance as a leader. (a) Nelson Mandela (18 July 1918 – 5 December 2013) South Africa's first black chief executive First elected in a fully representative democratic election who spent 27 years in prison South Africa -> Racial segregation -> Racial reconciliation His inspiring saying: It always seems impossible until it is done! A saying: ”leaders learn by leading and they learn best by leading in the face of obstacles” Consist of three forms: 1) A new conceptual framework (knowledge) for understanding and enhancing and facets of success 2) A measure of how you respond to adversity 3) A scientifically-grounded set of tools for improving how you respond to adversity Competence Paul G. STOLTZ 1997 What makes someone extraordinary? (b) Nick Vujicic If he gave himself up at the beginning, everything would be different How you see yourself? Have you ever thought to give up something in your life because you think its impossible? Never give up!! Rebounding stronger than before (Manurian, 2007) What doesn't kill you make you stronger... Some employers are using AQ to predict employees' levels of success, stress threshold, performance, risk-taking, capacity for change etc...... AQ Test Paul G. STOLTZ 1997 A service leader aims at satisfying the needs of self, others, and systems. Mandela: “It always seems impossible until it is done!” How you respond to adversity? Pursuit of human growth (Zeidner & Saklofske, 1996) Learn from the past, growing to be maturity Articles : Importance of AQ Practical case http://www.butlersnowadvisory.com/overcoming-adversity-in-business/ Suggestion toward AQ Change challenges into opportunities (Richardson, 2002) Family It always seems impossible until it is done! Nick: “Pain is Pain. Broken is Broken. FEAR is the Biggest Disability of all. And will PARALYZE you More Than Being in a Wheelchair.” To become an Effective service leader , you have to inspire your potential 66 people infected 6.5 million people immediate product recall cost 600